Category Archives: Tech

Alternators with multiple battery banks

I got into an excellent discussion elsewhere on how alternators work with multiple battery banks and isolators.  It’s not completely complicated, but it takes a lot of words to try and explain and make sense.  After scouring the internet for good illustrations and finding none, I ended up whipping up my own, and wanted to clean up my response afterward, expand on it, and make it a little easier to read.

The very silly TL;DR summary with multiple battery banks at different states of charge is that your auto electrical system is very socialist.  “From each (alternator) according to his ability, to each (battery) according to his needs.”  This is true with small tweaks whether your isolator is a relay or a diode, too.

What exactly happens when one alternator charges two batteries?

In a situation where you have an auxiliary battery connected to your starting battery with an isolator in between, how does the alternator’s regulator react? Lets assume the starting battery is at full charge (12.7v) and the aux battery is at half charge(12.0v)

From my understanding, the regulator would see a voltage of something in between the two, say 12.3v and continue to put a high voltage instead of trickle charging it to prevent damage.

Is my understanding completely off?

Lets say the starting battery is 95% and the house battery is 50%. In order for the current to get to the house battery, it would have to pass through the starting battery. And since the starting battery is still a lower capacity than the alternator gives, how does it not take in anything?

This question actually came up because I left the car heater vent on the lowest setting for days and didn’t realize it. Usually the dashboard shows the charging needle slightly tipped towards ‘Charge’ when I’m driving. This time, with the starting battery half drained, it was outputting much more current. What I noticed was, it also charged my house battery much faster too.

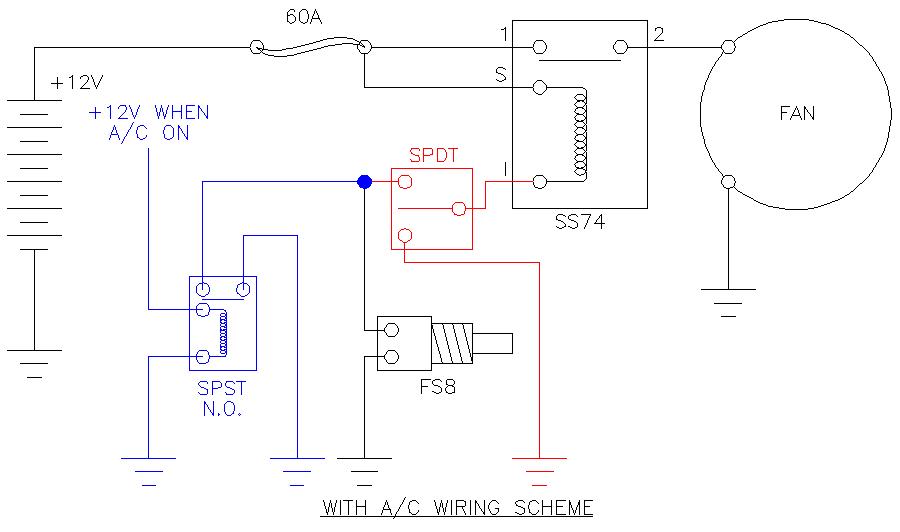
After a little discussion, I got a bit more good information from the original poster.  He has an 88 Econoline with a factory battery isolation relay and alternator, so I was able to cook up illustrations that were at least reasonably specific to a particular vehicle.

I had originally wanted to grab a couple of illustrations to make it make a little more sense, but after scouring the internet to see if anyone already had the right illustrations up, no one did. No wonder nobody usually understands how this stuff works. You can find illustrations all day of battery voltage during charge or discharge, but I never did find a chart of voltage (at a specific level of charge) as it changes depending on how much current you’re putting in or pulling out right at that moment, which is what you need to understand this.

I did enough hunting to make sure my information is right, and just did up my own illustrations after work one evening.

How does each piece of the system work on its own?

Before any of this makes sense, you need to be able to see how each piece acts under different electrical loads, but there are a lot of variables that change things. These illustrations aren’t *accurate* per say to any particular setup, but they’re “about right” for the stock 2G alternator and starting battery you get in an E-150 from around 1987-1994 or so, and hopefully just good enough to explain the concept.

Alternator

Most of the graphs for those show the max output current you can get depending on the alternator or engine speed, which doesn’t really help us much. What you really need to see is what your alternator will do at a fixed cruising speed as you increase the load on it.

Estimated and eyeballed; one day I'd like to set up a test bench to get real data for this instead.
Estimated and eyeballed; one day I’d like to set up a test bench to get real data for this instead.

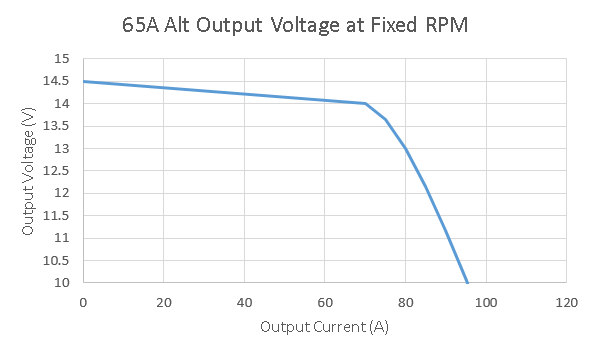
At cruising speed, you can see the voltage output of your alternator is mostly flat up to somewhere around its rated output, and somewhere after that, as you put more load on it, the voltage it’s able to put out drops. For the flat part of the graph, the voltage regulator is cranking the field up in the alternator to keep the voltage up. Once the field is at full strength, that’s all you have, and the voltage drops quickly after that as you increase the demand for current.

This does change as your engine speed changes.  At idle, with the anternator only turning about 2,000 RPM (usually about 3x crank speed), the cutoff point moves a lot farther to the left.  At cruise, most Fords will have the alternator turning anywhere from 4,000-6,000 RPM, and this is probably pretty representative of that.  If you’re running the engine faster, it does push the cutoff further to the right, but not by as much; you get to a point where all the resistance in the components basically wins out over spinning the alternator faster.  Most Ford alternators are good for around 16,000-18,000 RPM before things start breaking.

This curve isn’t accurate or based on real test data, because unfortunately I don’t have any and couldn’t find any.  This one’s based on information for separately excited alternators available in engineering texts, and modified with adding in the behavior appropriate for having a voltage regulator.  So yes, I’m sure this is what the curve looks like, but at the same time, no, I’m not confident of a single exact number on this graph, since I’ve adjusted it by eyeball.  Anyone want to get together and make an alternator test bench so we could get real numbers?

Starting Battery

Next up is what your starting battery does at different current levels.

Start battery at 90

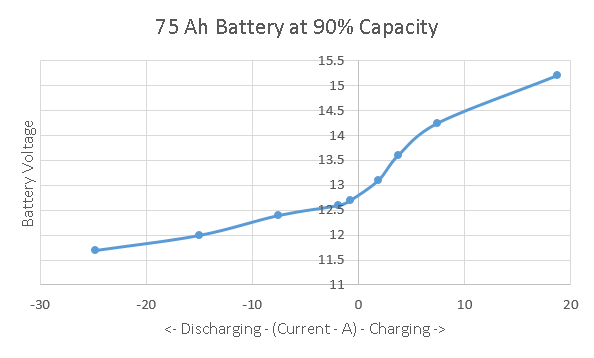
This was the hard part to find, and I ended up extracting this info from some really good battery charts put together by a boat guy for Home Power magazine.  These battery graphs are actually at least based on someone’s experimental data, so they’re a little more accurate than the alternator graph I have above.  To get this graph, I essentially took the chart on the last page of the linked document, and took the values at one “slice” at a specific state of charge (90% for this first curve), then adjusted for the battery size.

Everything on that curve above changes with both how big your battery is, and how discharged it is, so I’ve made one for each of the different situations we’d need to look at to understand how isolators and multiple battery banks work together. For this first one, it’s assuming about a 75Ah lead acid battery (basically the Group 65 battery in an Econoline).

As you look to the left of zero on the bottom, that’s discharge current, with your battery supplying power. To the right is charge current, with power being put into your battery. What you can read roughly off this chart is the voltage. This chart has about the right voltage numbers for your starting battery being 90% charged, which is pretty normal for just having fired up a van that’s sat for a little while.

The least accurate part of these charts is right around 0 current.  Lead acid battery behavior is very “fuzzy” in this area, and the voltage depends on a lot of other things, so don’t pay much attention to the line that connects the lowest “charging” and “discharging” currents; it doesn’t mean a lot there.

The simplest system: One alternator, one starting battery

Low Load

Now, let’s look at the first and simplest combination, just your alternator and your starting battery. Right after you fire up your van, the alternator kicks right up to 14-14.5V or so. Your van’s fuel pump and electronics are taking maybe 30A to run, so your system will probably be at around 14.2V – you have to “guess” first to figure this out, and then go back and add things up to see if your guess was about right.

What’s important to see is that your battery and alternator are tied together, so they *have* to be at the same voltage. At 14.2V, your alternator can put out about 42A, and your battery “wants” about 7A worth of charge, so 14.2V would be right if the rest of your system is demanding about 35A right then.  Pretty close, but maybe not quite a good a guess as we can do, because the currents don’t quite balance out – your car and battery want 37A together, and the alternator wants to put out 42A, so we’re off a little.

I can skip a step and say 14.3V works out too high, so let’s try halfway between at 14.25V.  At that voltage, the start battery wants 7.5A, and the van still wants 30A to run, and the alternator wants to put out 35A.  That’s pretty darned close – within a couple of amps – so I’d call 14.25 the answer.  It’s probably a little bit too precise considering how rigged up the charts are.

Medium Load

Now with that simple one alternator/one battery combo, let’s crank on the headlights and turn the fan on low; now we’ll say we’ve raised our load from the van to 50A.  Let’s guess 14.1V for the system voltage.  Looking at the battery chart, the battery charge current is probably going to drop to more like 6.5A at that voltage, so your total load is now about 56.5A.  Your alternator graph says it’s putting out about 56A at that voltage, so our guess was good!  56A coming out of the alternator will split into about 50A going to the van and 6A going to the battery.

High Load

Okay, time to overload the alternator. Crank the heat on max (those blowers draw about 20A on max), turn on the rear air, and maybe heated seats. Flip on the wipers, get everything going. Now we’ve got about 90A of demand in the system. That’s way more than the alternator can put out by itself at above 12V, so if you trust the slightly fictional chart I made, your alternator can only put out about 11.5V at that load.

Battery to the rescue! It’s still connected, and if it were actually at 11.5V, it would really be putting out some juice! What’s really going to happen is that the system is going to settle at whatever voltage the output current from the battery and the alternator add up to 90A.

Looking at the chart, that looks like about 12.4V to me. At 12.4V, your alternator can still crank out 83A, and your battery is going to put out the remaining 7A.

The Simple System TL;DR

I picked the simple situation first because this one has to make sense before you can understand what happens when you throw in a second battery bank with a different charge. In this simple example you already have two things that can put out power (alternator and battery) that have to “decide” how to share the load. The thing is, it’s not really so much a “decision.” Each thing has it’s own natural behavior that the chart tries to make sense of, and the system has one “natural law”, which is that the voltage for all the pieces we’re looking at will always be the same (because they’re directly connected). Hence, the alternator and battery will increase or decrease output until the voltage stabilizes between them. It’s a bit of a physics balancing act.

Adding an AUX/House Battery Bank

Low vehicle load, 50% Aux battery charge

Now, let’s go back to the first example where you’ve just started the van and have a reasonable 30A system load, but now we add in your house batteries. Let’s say your battery bank is 200Ah, equivalent to almost three of those starting batteries in size – I want to exaggerate things a little so it’s easier to see the effect in the different charts. Your battery bank is only 50% charged when your isolator relay connects it to the alternator and starting battery, so its chart looks like this.

House battery at 50

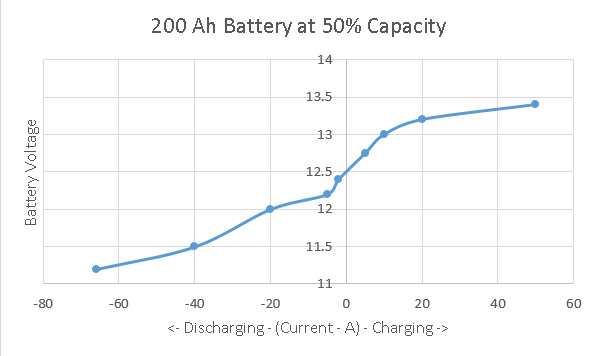
The shape is really similar, but the currents are much bigger (because the bank is bigger) and the voltages are lower (because the bank is half discharged). Your van’s system still wants about 30A to run its own stuff.

So now, with that isolator relay connected, the “all the voltages are the same” law applies to all three pieces. To figure out what it’s going to do, I have to guess a voltage again to start. I can make an educated guess and say maybe the system will run at 13.5V, which looks pretty close. Let’s see, at 13.5V our alternator puts out about 76A, and our demand is 30A (from the car’s electronics) plus about 3A (what the mostly charged small battery wants at that voltage) and a whopping 65A that our hungry battery bank wants at that voltage. That’s a total load of 98A, way more than the alternator is putting out, so I’ve obviously guessed wrong!

If I try again it comes out closer – At 13.4V, the load is 30A car, still about 3A starting battery (too small a change to tell from the chart), but down to about 40A on the battery bank. The alternator can put out just a few more amps, too. So the load goes down to 73A, and the alternator’s capacity creeps up to maybe 77. Basically, we’re about there; 13.4V is about as accurate as we can get with these charts.

With that example, you can really see how the power gets split between the two battery banks. Your starting battery doesn’t want much; it’s too full to take much more charge at that low of a voltage, and the voltage is still too high for it to discharge at all. Meanwhile, your aux battery bank is hungry, and it’s just going to suck current in until it drops the alternator’s voltage down to a level where it’s being satisfied.  As the current goes up, the alternator’s voltage drops, and as the voltage drops, the aux battery’s “hunger” drops, so they meet in the middle.

Low vehicle load, 50% Aux battery charge

Now, to see what was going on with your rig the other day when your aux bank was really down, here’s a curve for your aux battery at only 20% charge.

House battery at 20

This is enough of a difference to start to suck juice out of your starting battery, just like you saw, though not much at all yet.

I’m going to guess 12.7V first. At 12.7V, your alternator is putting out about 82A, your start battery is actually putting out about 1A. Your van still wants 30A to run, and your aux battery wants to suck up a full 50A! That’s probably a pretty good guess on the voltage, we’re within a couple of amps of everything adding up. 83A or so from the alternator and start battery, and 50 of it going into recharging the auxiliary bank.

You can see where even small changes in my guesses on making those graphs would make it draw harder from your starting battery.

  • If your aux was less than 20% charge left, you’d definitely pull a lot harder from the starting battery, since your alternator is completely maxed out.
  • My “alternator curve” could easily have been generous for that alternator over 70A, too, since I just cooked up that part of the curve “by eye” until it looked right. Unlike the batteries, I don’t have good hard data for that one, just enough basic knowledge of how it works to cook up a chart.
  • The smallest increase in load from the van itself is going to come almost straight out of your starting battery now, with house battery charge current decreasing.  The alternator is almost completely maxed out,  so if you turn out the heaters for 10A (for 40A total for the van), the voltage drops a tiny bit to 12.68V, your alternator still produces about 82A, the starting battery puts out about 2A, and your aux charge current drops to only 44A (for an 84A total load).  Doesn’t sound like much, but the ammeters in the Ford dashes are actually really sensitive, and you’d definitely see that as a very noticeable needle twitch.

On the other hand, this goes to show why you shouldn’t worry too much about a relay isolator causing your aux batteries to “drain” your start battery when the car is running.  You have to really drain down your house batteries before they even start pulling any current out of your start batteries, and even then, it’s a tiny trickle.

At the same time, you can see how recharging the house batteries from a really low charge really works the snot out of the alternator.  Not a good part to cheap out on.

What about a diode isolator?

A diode isolator does change things, and not always in a good way.  It does guarantee that your house bank won’t pull charge directly from your starting bank when you’re running.  However, as you can see from the examples above, that’s not really a big risk even with a simple relay.

What a diode isolator definitely does is change the shape of the alternator curve.  Diodes have what is called a “forward voltage drop” when they’re working.  This is basically a fixed voltage loss whenever current is flowing.  I understand for most alternator diodes this is about 0.9V.

To compensate for this, the “voltage sensing” wire for your voltage regulator is still attached at the starting battery, on the downstream side of the diode (do not attach on the aux battery side instead).  If your regulator wants 14.2V, it’s going to crank the field on the alternator higher, until the alternator is putting out 15.1V.  This will produce 14.2V on the downstream side of that diode.

This affects alternator performance three ways:

  • It adds load to the alternator.  If you’re producing 50A, you are losing 45W crossing the diode, so that’s another 45W the alternator has to put out.  This means your alternator will always run a little hotter.
  • It reduces the alternator output where the regulator maxes out.  Because it’s taking extra field strength to supply the extra 0.9V, your regulator will run out of the ability to add extra “kick” at a lower output current, so you “fall off” the flat part of the curve earlier.
  • You lose voltage everywhere above that flat spot for a given current, so your charge performance when the alternator is maxed out decreases very measurably.

I’ve made another rigged up chart that shows this behavior.  The overall curve isn’t the most accurate, but the difference in performance is pretty on-the-mark.


Ouch!
Ouch!

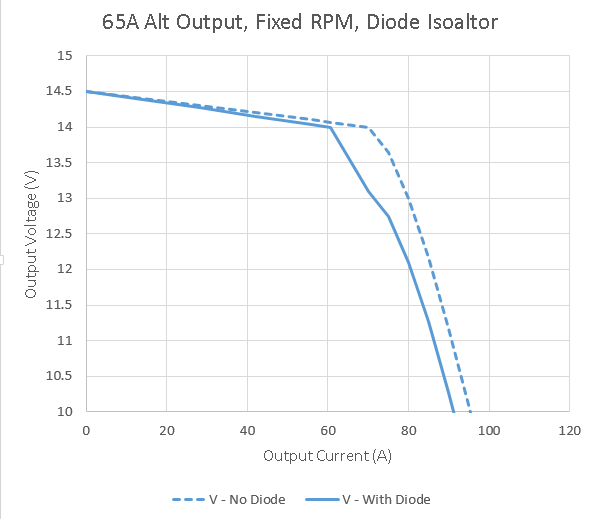
The original alternator curve is dotted.  I’ve stretched the graph a little taller to make the differences easier to see.  It’s a little squiggly from 14 to 13V, but overall it’s about right.

As you can see, there’s not much difference when you’ve got a low load.  However, once you’ve maxed out your field, whoa!  What a difference.  The alternator that was rated at 67A would probably be rated at about 58A now if you used the same criteria.  You lose almost 5A all the way through the range.  All your lost power is going into the 50W+ or so that your diode is eating.

This is why I like isolator relays.  Even at the very high currents you get recharging a 200Ah bank that’s drained way down, I can get a continuous duty solenoid that will handle the current for $40 tops.  I’d much rather spend the extra money you’d pay for a diode isolator (about $35 extra minimum for this alternator size) toward a much better alternator instead.

So what’s really going on here?

Nothing in the system really knows how to distribute the electricity, each piece just has it’s own performance characteristics, and the system will “balance out” naturally to whatever voltage makes the available supply (from the alternator) meet the demand (from the car electronics, and the two battery banks).

Plus, diode isolators are the devil!  (Your mileage may vary)

An update on last year’s distributor failures

I thought I’d add in an update on the (hopefully) final resolution of last year’s 300 I6 distributor trouble.  I had one more failure, not long after my last post, and it was a particularly inconvenient one.

On 6/13, the roll pin for the distributor gear fatigued.  Thankfully, it didn’t completely shear, but it did lose a layer on both ends, which means I lost about 20* of timing and all power.  Unfortunately, it did this at 70mph, on a 95*F day, in the left lane, passing a semi on the interstate while pulling a loaded stock trailer, with a truckload of our good working dogs, 130 miles from home.  I can think of less pleasant breakdowns, but not too many.  This represents about 2,000 miles at most on this particular distributor install.

Thankfully, we were only twenty miles from a friend’s farm, and she came to our rescue.  We left our rig and stock at her place overnight, and came back the next day with a couple of spare roll pins and enough tools to replace one roadside.  We carefully limped everything home, and I started doing a postmortem.

My final conclusions on the problem came down to:

  • Never re-use a roll pin in a distributor.  The pin that sheared was the original pin from the Rich Porter.  It may have been low quality to start with.  Use an upgraded new pin every time you pull one out.
  • You can’t get a properly made 300 I6 distributor, remanufactured or aftermarket.  You’re going to need to do some careful re-engineering to reliably use any replacement you get.
  • For the love of all that is holy, if you have a factory distributor that isn’t absolutely FUBAR, don’t replace it!  I’ve never, ever personally had a distributor failure on a Ford that still had it’s factory distributor and where no one has screwed with it.  Maintain or repair as needed, but any replacement you get is likely to be worse than the broken unit you’re pulling.  I have no idea why the original part was swapped out on this engine before I bought it, but I’d wager good money it was because someone was throwing money and parts at a problem that had nothing to do with the distributor.

Here’s why your new or reman distributor is most likely to experience roll pin fatigue failures.  The distributor gear should be a press fit on the shaft.  That press fit should be what’s carrying all the load, and the pin should basically be a safety device.

However, the machining on new distributors is crap, and you can almost bet any reman you get will have had a failure which spun the gear on the shaft (my reman NAPA Echlin arrived that way).  Either way, every distributor I’ve put in during this saga has had a distributor gear I could turn on the shaft by hand without the pin installed.  The combo that fatigued on me was the loosest, and when you combine it with re-using the cheap pin that came from the RichPorter, you can see why it died.  In fact, when I re-pinned the NAPA and drove it carefully home, the pin I popped in (which was the original NAPA pin) had already started to fail when I pulled it out that evening – under 150 miles.

My solution to this has so far worked for six months and about 10,000 miles.  First, I bought a 100 pack of brand new, high strength roll pins.  They are about 30% stronger than the standard roll pins of this size, and probably almost double the strength of the off brand pins that came with both the Rich Porter and the NAPA reman.

Second, I went ahead and bought a brand new Rich Porter, with the intention of immediately tearing it down.  They are almost the only game in town in terms of new 300 I6 distributors, and if I’m going to start with junk either way, I’d rather it be new junk with a lifetime warranty.  Upon arrival, I immediately pressed out the crappy stock pin, pulled the gear (which was loose, but a lot better than the NAPA unit started out), and removed enough end play shims to get the end play up to 0.030 where I wanted it.  I really didn’t want a repeat performance of the original Rich Porter getting too tight and popping it’s hall plate off the top splines, since that was the only problem I actually had with the original Rich Porter.

After a careful break-in and timing set, that combo has now been in for about 10,000 miles, including plenty more miles on the interstate with the stock trailer.  That means this has also lasted at least 6,000 miles more than any other distributor we’ve had in it since purchase last year.

I was also determined not to get stuck by a failure again if I could help it.  I replaced the already fatiguing “new” pin in the NAPA with a new high strength one, and have that crap distributor and enough tools and spare pins to change and repair it roadside sitting in the van’s toolbox.  I’ve got that routine down to about 20 minutes, which is a lot faster than the tow truck showed up.  I just checked the pin by feel last Friday (the shaft movement feels “soft” when they’re starting to break), and so far it still feels good, with no measurable timing loss with the light either.

I’ve seriously considered selling these nice little pins as singles or small packs on eBay or Amazon.  At $2 a pin plus the cost of a stamp and an envelope, they’re a lot cheaper than the 100 pack I had to buy, and cheaper than the single pins anyone else is selling online (mostly $5 and up).  You can’t get them in quantities less than 100, and I hope to never use up the other 99.  They’re high strength steel and have a minimum double shear break strength of 2,000lb, which means they are good for 44 ft-lb for the distributor gear in a 300 or 351W, or 39 ft-lb in a 302 (smaller shaft).  I’ve got the info on them if anyone wants them, or would probably mail a few for a couple of bucks plus postage.

Here’s hoping this helps someone else out, too.  I’ll update again if I ever get another failure with this.  Meanwhile, I’ve seriously started considering getting my own shafts machined so I can actually get a proper fitment.  Most likely I’ll probably end up swapping in the spare 302 I have instead, though.  The 300 isn’t the best in the world right now with a stock trailer at 70.

How are engine displacement and power/torque related?

I got involved in a discussion elsewhere on this topic, and wanted to share my response here as well.  This is meant to be a solid explanation in layman’s terms, for those who don’t want to dive down a big physics and thermodynamics rabbit hole!

While I’m an automotive engineer I’m ashamed to say that I still don’t really understand the relationship between displacement and power/torque produced. While I assume that the difference between the 1000+hp – 8l engine in the Veyron and the 645hp – 8.4l engine in the Viper is mostly determined by turbos I would prefer a more detailed explanation.

Leaving out for a moment questions of efficiency, turbocharging, and a lot of other smaller factors:

  • Torque is most proportional to displacement. This is mostly a matter of how much fuel you can burn per cycle of the engine. Torque is a force, and applies to questions like, “how heavy a car can I push up this slope?”
  • Horsepower is proportional to the product of torque and engine rpm. There’s a constant in the equation, but otherwise it’s a direct relationship. Power applies to the question, “How fast can I push this 4000lb car up this slope?”

Everything else is just a factor that modifies those two variables. Let’s take the steady-state example of a truck climbing a steady grade at a steady speed – it’s actually simpler to understand than everyone’s favorite “drag race” example. Want to increase the amount of load you can carry up the hill at a given speed (increase the power)? Here are the ways you can do it:

  • Make the engine bigger. If everything is proportional so that your efficiency is the same, your torque will go up proportionally as well, because you’re ingesting more oxygen and burning more fuel. This means your power will also increase proportionally. More torque at the same speed (more power) means you can pull a heavier load up the hill.
  • Spin the engine faster for the same road speed (RPM). You’re still making roughly the same torque at the engine, but to maintain the same road speed, you will have had to change the axle/transmission gearing. This gives your same engine torque more “leverage” on the road. This example both shows the difference between torque and power, and shows you why it’s power that matters for climbing hills. Looking directly at the power really tells you what your engine can do at a given road speed once you’ve factored in all the gearing – it simplifies everything (better tool for analyzing that type of job).
  • “Fake” making the engine bigger. You can do this with turbocharging, supercharging, nitrous oxide … your choice. Either way, you’re using an external component to force additional oxygen and fuel into your engine, faking the behavior of larger displacement. The result is more power. This solution will almost always be more efficient for some operating conditions and less efficient for others, so you get to pick where you gain and lose economy, too. You have to do more work “stuffing” in the extra air, which reduces efficiency, but it can let you tune for better efficiency when you don’t need full power. Ford Ecoboost is a good example of this idea.
  • Improve overall efficiency. You can do this by increasing compression, tweaking your spark timing, mechanical/frictional tweaks, anything that gets more of the energy from your fuel to your tires instead of going out the tailpipe and radiator. You tend to be pretty limited by your fuel quality here compared to the first three options.
  • Improve efficiency at the engine speed you’re operating. Change your valve timing. Here, you’ll trade better efficiency at the RPM you care about for worse efficiency elsewhere. Your limit here is that you still have a “peak” torque value proportional to displacement, which you can move around with valve timing but not really increase. Assuming you don’t change your gearing (RPM) at the same time, once you get to the point where your peak torque is at the RPM you’re climbing the hill, you’ve gained all you can with this option.

In short, power is everything. Torque only really matters in that you’d like most of it to be “well distributed” across engine RPM, instead of very concentrated in a narrow band – this just makes your engine more versatile and nicer to drive. However, for pulling a hill, etc, the question of “not enough torque” is always solved by “more gear”, because the power is the same either way; that power is really just a matter of how much oxygen you can stuff in, and how much heat you lose from there to the tires.

For a good comparative example, consider the difference between the 110ci engine in a Miata and the 300ci engine in a mid-90’s Ford. I have both. Both make roughly the same HP, plus or minus a few – around 140.

The Miata has high compression, good mechanical efficiency, and all of its variables (valve timing, etc) are tuned to maximize the available torque and power from 5,000 to 7,000 RPM. It’s torque curve is very peaky, maxes out at about 115 lb-ft, and below 3,000 it’s essentially worthless. This is okay for acceleration, because everything is lightweight, and the car has very steep axle gearing (4.56:1) to try to keep it where it makes some power. However, you’d never want to tow anything with this engine, because the high RPM and compression really limit reliability if you needed to make the full 140 horsepower long enough to, say, climb a 10 mile hill, something you’d never need in a 2500lb car even at full speed. You need five (efficient, manual) gears at a minimum to keep this little engine where it will get out of its own way, and you’re shifting constantly in hilly terrain and traffic.

In contrast, the 300 is in a 90’s van with a three speed automatic, probably the most reliable but inefficient transmission Ford ever produced. Because of the massive energy-suck of the transmission, considerably less of this engine’s power gets to the road than the Miata’s. It’s in a vehicle that weighs double what the Miata does, and which will happily tow its own weight – so this engine is happy moving four times the load of the Miata. Why? Rather than focusing on a narrow “happy” spot, the design focused on distributing it’s torque out well. It doesn’t have overwhelming “go” anywhere, with only 260 ft-lb of peak torque limited largely by very low compression compared to the Miata; at the same time, what “go” it has is available everywhere (over 200 for almost the entire operating range). It makes its maximum power at only 3500 RPM, which it will happily do all day long, on crappy fuel, in lousy, hot, humid weather. Because the torque curve is so flat, you almost never find yourself shifting for any hill but the most extreme. It’ll never get anywhere as fast as the Miata, but it will go everywhere with extreme reliability doing four times the actual work, strolling along like a big, dopey draft horse.

You can dive down the rabbit hole all day with the hundreds of smaller variables that affect torque and power, but sometimes the basics are better summed up with no math and a little example or two. If nothing else, hopefully this version was entertaining.

Second failed distributor

So far the parts stores are 0 for 2 on good distributors.

Failed distributor drive gear
Another failed distributor! This one a reman.

That’s what’s left of the bronze distributor gear on the NAPA Echlin reman I installed in the last post.  This gear survived around 1,000 miles at most.

On the other hand, a postmortem on the pair of dead distributors, and a review of the Ford documentation on distributor drive gears, has shown me a likely common cause for both failures.

Ford indicates in the linked document that “very little or no shaft endplay… has been found with new and remanufactured distributors. Improper endplay may force the gear against the support in the block or hold it up off the support, causing damage.”

Before I began the repair, I checked the distributor shaft end play on both the NAPA with the failed gear, and the Rich Porter with the failed rotor plate (after pressing it back on).  Both were in the neighborhood of 0.010″ to 0.012″, which is substantially less than the 0.024″ to 0.035″ called for by Ford.

The distributor is a steel shaft in an aluminum housing.  As the assembly heats up, the aluminum grows more than the steel shaft, and the end play measurement decreases.  If you have too little end play, the end result can be that your clearance goes to zero, trapping the housing between the rotor plate and the drive gear.  This could easily either press the rotor plate off its splines, or in the case of the NAPA unit, put so much load on the softer drive gear that it wore out almost immediately.

I needed a rapid fix, and swapped the perfectly good steel gear from the failed Rich Porter onto the NAPA distributor.  Since I had to re-drill the roll pin hole in the process anyway, it let me set my own clearance, and set it properly.  I set the clearance to 0.032″, and so far I’ve had zero issues since the repair (approximately 1000 miles).

As the NAPA gear wore, it manifested in progressive loss of base timing as the teeth wore away.  When I sorted out the cause of the problem I was having (misfire, loss of power and fuel economy), I measured a loss of 6º of base timing on the #1 cylinder.  However, #1 was one of the least worn teeth, visible at the bottom in the photo.  Based on the wear in the other teeth and the difference in rotational play with the distributor still installed, I was losing at least 10º on the #6 cylinder, where I was seeing the most misfires.

Currently, after a timing re-check yesterday, I’ve lost less than 1º of timing since I set it after breaking the gear back in.  Actually, I’d say zero, but my timing light just isn’t that accurate.

As a note on the Ford 300 inline six, there’s very little drawback to setting your distributor shaft end play high.  Unlike the V8 engines, the distributor rotates clockwise from the top, and as you can see from the wear on the gear, that means the gear rides up on the plain bearing surface at the bottom of the distributor housing, not on the gear support block inside the engine block.  Because of the load of the oil pump, the gear will stay up against the housing steady as the engine is running, so you won’t have a timing variation.  A bit more end play just puts your rotor a tiny bit higher in the cap – nowhere near enough to cause an interference.

Failed TFI aftermarket distributor

I experienced a new-to-me form of failure a week or so before Christmas, and thought I’d share the details, since even a pretty detailed Google hunt failed to turn up any other account of this problem.

The vehicle is a 1996 Ford Econoline with a 300 I-6. After driving around perfectly for an hour, it suddenly lost most of its power mid-drive, running smoothly but unable to exceed about 10mph. Manual shifting of the C6 proved we still had both first and second, and it still started acceptably (if weak), with no sign of engine shakes or cylinder misfires. A quick roadside diagnosis showed no new codes, nothing out of the ordinary in the OBD II data stream, and a look at the distributor indicated it was still tight and hadn’t shifted from the previous owner’s paint mark (which was correct, I’d checked timing in November after purchasing it).

After a tow home, I began diagnosis. After eliminating some of the other basics, I got the timing light out, and found it was running with a base timing of about 20* ATDC. Loosening the distributor hold down and twisting in about 30* more timing immediately removed the symptoms. Then, it was time to find the cause.

With a loose hold down bolt ruled out, the usual suspects would be the timing set, the distributor gear at the cam, or the shear pin that holds the gear to the distributor shaft. A dead timing set or stripped distributor gear usually mean no start, not timing slipped. I suspected the shear pin might have went, with the gear just tight enough on the shaft to have “stuck” after losing some timing.

I pulled the cap and rotor, and everything looked normal at first glance. Here’s a shot after having pulled the distributor.

Richporter TFI distributor
This is the failed distributor, which looks innocuous with the shutter wheel still on the shaft.

However, once I grasped the shutter wheel and gave it a bit of light torque, I immediately felt a “notchy” click, and was able to rotate it.  The possibility of a magic “half-stripped” distributor gear went briefly through my head, but it didn’t take long to realize the distributor shaft wasn’t turning at all.  In fact, the shutter wheel popped right off in my hand.

Failed distributor
This shot shows the failed component. Notice the stripped splines where the TFI shutter wheel should press onto the shaft.

At that point, it was obvious what had happened, though I still can’t point to why.

I pulled the distributor, verified the gear and shear pin were in fact fine, and popped in a NAPA reman, which was the only thing I could get locally that day.  The failed unit was a Richporter Technologies, and the NAPA is a reman Motorcraft.

I still have no clue why the original distributor was replaced by the previous owner – I’ve never had an original actually fail, and this engine has pretty low mileage for a 300.  I’m guessing his mechanic swapped it in when they were trying to hunt down a SPOUT circuit error, which I suspect is part of why I got this van so cheap.  That was something simple I fixed five minutes after we bought it – a slightly loose terminal at the back of the SPOUT connector.  Haven’t had a single real issue with it other than the SPOUT issue and the newly failed aftermarket distributor.

Identify your axle gear ratio

Have an axle with an unknown ratio that you’d like to identify? Want accurate results? Here’s a simple, dead accurate method that will give you results on any rear wheel drive axle (or any front axle for a four wheel drive), as long as the axle in question is driven by a driveshaft. Sorry, front wheel drive folks, you’re generally out of luck on this one. This is a single-person technique. Helpers are not required, though one does make the counting a bit quicker.

Tools required:
Chalk, crayon, or paint pen
Jack
Jack stands

Safety:
I make the general assumption that you already know to follow all the necessary safety techniques. If you don’t already know how to do anything required here safely, find a friend to learn from, or another source of knowledge. General work safety practices for cars abound on the internet. Hence, work at your own risk.

Steps:

1. Determine if you have an open differential, or a traction aid (limited slip, locker, etc.). If you don’t already know, here’s how. Jack up the axle and put both sides on stands, so both wheels are off the ground. Leave the transmission in park or in gear (manual). Rotate one wheel by hand, while watching the opposite wheel. If the other wheel rotates easily in the opposite direction, you have an open differential. If there is resistance to rotation or no rotation, you have a LSD or locker. To verify a traction aid, place the transmission in neutral, and both wheels should rotate together when you turn one by hand. I’ll note differences in later steps between open and traction aid techniques.

2. LSD/Locker: leave the car on the stands. Open diff: lower one tire to the ground, leave the other on a stand.

3. Mark the tire and driveshaft. Put one mark on the tire sidewall where you can easily see it, and another on the driveshaft near the axle. You’ll need to be able to see both from where you’re working unless you have a helper, so they should both start out facing you. If you have a lot of tire clearance to your fenders, it’s often easiest to start with the marked spot toward the ground, and a block of wood or rock to use as a reference point. You want to be able to count tire turns to within a few inches of your starting point; more accurate than that won’t really be necessary.

4. Now, you’ll need to rotate the tire while counting turns of the driveshaft using your mark. Rotating forward or backward doesn’t matter. Turn the tire 10 turns for an LSD/Locker, 20 turns for an open differential. When finishing, try to count your last driveshaft turn to the nearest 1/4 revolution.

5. Divide the number of driveshaft turns you counted by 10 (same for both LSD/Locker and open). That’s your gear ratio.

Examples:

  • You determine your pickup has an open diff, so lower one tire to the ground. You turn the tire 20 turns, and count 35-1/2 turns of the driveshaft. 35.5 / 10 is 3.55 – a common stock gear ratio for Ford pickups.
  • Your car has a limited slip, so you leave both tires up. You turn the tires 10 times and count about 27-1/4 to 27-1/2 turns. This will be either 2.73 or 2.75 depending on your axle make and what ratios are available.

The last number is always a bit of a fudge with this method, but always close enough, as you’ll basically never encounter a single axle make that has two different ratios available that are so close. You can always count on the first two numbers, such as 2.7x and 3.5x, being dead accurate, and that’s always close enough to identify the exact ratio once you know what axle family you have. For instance, with a Ford, the 2.7x example is going to be 2.73 if you have an 8.8″ or 7.5″ axle, or 2.75 if you have an 8″ or 9″ axle.

I’ve used this method many times over the years, since it’s dead on and works great whether the vehicle still has its stock gears or not; axle tags are only useful if no other previous owner decided to regear. I also take a crayon with me any time I’m headed to a junkyard or to purchase an axle, for the same reason.

Happy counting!

Machining differential carriers for the Ford IRS

Using a non-IRS limited slip in a 7.5 or 8.8 Ford IRS axle requires the builder to choose between leaving out the axle retainer clips, or machining the differential side gears to accept them.

For those who want to keep their retainer clips, I’ve come by the following diagram for machining the side gears:

Machine work diagram
Machining Differential Side Gears for the Ford 7.5 and 8.8 IRS

I originally found this drawing on TCCOA in a post here, courtesy of 392Bird.  No idea where it originally came from.

The side gear in the drawing is straight cut, unlike the gears used in the Trac-Loc, but that doesn’t really matter.  What’s important here is the bevel machined between the inboard side of the splines and the gear face for the c-clip.  This bevel will allow your IRS retainer clip to compress, so that you can remove the half shaft without having to disassemble the center section to compress the clip.

Measure twice, cut once

This is an example of why you always check your assembly tolerances as you’re putting an engine together.  The image that follows is the cam sprocket from an Edelbrock 7814 set I purchased last week.

Defective cam gear
Defective Edelbrock 7814 cam sprocket

Can you spot what’s wrong already?  If you can’t see it in the view above, click the link to the full resolution of the photo.

Ford uses a simple system to control camshaft end play.  The sprocket face above bolts to the end of the front cam bearing journal, creating a gap between the second step on that sprocket and the journal face.  Sandwiched in that gap is a hardened steel or cast iron camshaft retainer plate.  The difference in thickness between the gap and the plate thickness ends up being the end play.

When putting together an engine, my normal procedure is to install the cam, bolt up the cam sprocket temporarily so that I can check end play while it’s easy to get to, and then remove the cam sprocket and proceed to the crank and the rest of the rotating assembly.

Since I always measure and remove anyway, I didn’t pay too much attention to the new cam sprocket when I was installing it last night, which gave me ZERO end play once installed.  The cam would turn by hand, but I was probably less than a thousandth of an inch of luck from full bind.  Of course, running the engine in this state probably would have lunched the build very quickly, which is why it’s best to measure everything as it goes together.

I was re-using the original cam with a new camshaft retainer plate, so my first thought was a machining error in the Ford plate.  I swapped to the old Ford retainer plate and got the exact same result.

I’d have saved myself about ten minutes of head scratching if I’d looked at the sprocket first.  If you look at the two protruding faces, neither is machined.  They are both as-cast surfaces.  You can see a bit of the hub of the original sprocket in the bottom left of the photo, for a comparison of what that finish should look like.  Or, just take a quick peek below.

Simply put, someone at the factory making this part for Edelbrock just missed a step.  At some point during manufacture of this piece, it should be chucked in a lathe, and those two surfaces turned to meet the end play tolerance.  Someone just missed it.  This surprised me, since it’s the only defective part I’ve ever personally gotten from Edelbrock.

Luckily, a phone call quick trip to Advance the this morning before work got me a part that was completed.  I’d bought their only 7814 in the region, so I paid another $12 and swapped to an Edelbrock 7811, which is interchangeable with the 7814 other than a pair of extra keyways to advance and retard the cam timing.  Problem solved, no hassle, and my one Edelbrock “oops” will go back to them.

Here’s the 7811 with the correct machining.  You can see there are four lathed surfaces here that were missed on the first one.

Edelbrock 7811 sprocket
Edelbrock 7811 cam sprocket

A Note on Measuring Camshaft End Play

I’ve noticed a very common and very critical omission in most of my shop manuals that turns up on forums fairly often.  Off the top of my head, this tidbit is missing in two Ford factory shop manuals I own (1993 Mustang and 1991 Truck), as well as a smattering of Haynes and other manuals I have.

All of these references instruct you to install the cam, install the retainer plate, check the camshaft end play (the tolerance is 0.0055-0.009 for fuel injected 302’s), and then install the timing set.

If you follow these instructions as they appear in every manual out there, you will do a lot of head scratching, because you’ll see anywhere from 1/10 to 1/4 of an inch of camshaft end play.  Don’t worry!

How to measure camshaft end play (the one and only way that actually works):

  • Install camshaft
  • Install retainer plate
  • Install and torque cam sprocket
  • Measure end play
  • Remove sprocket so that you can install remainder of timing set

Without the sprocket installed, the only thing controlling your end play is the plug in the camshaft bore all the way in the back of the block.  The sprocket must be installed in order to measure, but I have yet to find a manual that points that fact out, at least in my collection.

This little anecdote is personal experience, as I was one of the head scratchers the first time I ran into this.

Fuel octane myths

Higher octane fuel will give me more power!

This is the big one.  Unfortunately, higher octane fuels do not generally give you more power.  If only it were so easy.  A higher octane fuel has almost exactly the same energy as a lower octane fuel, and if all goes well, it burns identically.

There are exceptions to this in the automotive world — quite a few modern cars run knock sensors, and with a lower octane fuel, the computer will be forced to retard timing to prevent knock, which will typically cause power to fall off.  HOWEVER, this does not mean that a higher octane fuel will bring more power, only that running the grade of fuel the engine was designed for will provide optimum power on a car equipped with a knock sensor.  Once you reach a point where octane is sufficient such that the computer doesn’t have to pull timing, there are no more gains to be had.

Higher octane fuels burn hotter.

One common myth concerns the ignition/burn temperature of higher octane fuels.  Many people, including quite a few who should know better by now, continue to perpetuate the myth that higher octane fuels require more energy to ignite, or burn at a different temperature or rate (usually “more slowly”).  This is simply not true.  Though burn rate can vary between fuels with all other things being equal, this is not linked to the fuel’s octane rating, and other variables like mixture quality and distribution have a MUCH greater effect on burn rate.
Octane is also not directly a measure of the amount of compression it takes to initiate burn (preignition or detonation).  Although they are often connected, knock is not necessarily directly linked to preignition and detonation.  Knock, specifically, is a violent resonance of the gases in the combustion chamber, causing severe spikes in pressure and temperature, and usually audible from outside the engine.

It is possible for detonation (spontaneous ignition and simulaneous burn of the entire air-fuel mix ahead of the flame front created by the spark plug) or preignition (spontaneous ignition of pockets of flame ahead of the main flame front, caused by heat and pressure, which then burns at a normal rate) to occur without knock, and it is also possible for knock to occur without preignition or detonation.

This phenomenon was studied extensively in the 40’s via high speed camera by NACA (predecessor to NASA) when they were developing many of the more sophisticated late WWII era piston aircraft engines.  However, with the massive shift in research from piston to turbine engines at the end of the war, a lot of the NACA research was filed away and forgotten.  Their information, which is now freely available from NASA over the web, is a treasure trove of information on detonation, supercharging (including turbocharging, which is simply a form of supercharging), fuels, water injection, and even things as odd as using nozzles on jetted exhaust pipes to gain thrust (don’t get too excited, it doesn’t benefit much below about 250mph, and is useful mostly because propellers start to lose efficiency at higher speeds).

For more information, the NACA article covering knock and detonation can be found on the NASA Technical Reports server.  Search for NACA-TR-912 and enjoy!

Simple electric fan control

Want to make an electric fan control harness without having to buy someone’s expensive solid state setup?  See below for three ways you can go about it, depending on how many features you want.

  • All of these setups are based on a Ford Taurus fan, or something with a fairly equivalent amp draw (approx. 38A continuous once it’s running).
  • Relay SS74 marked in the diagrams is also equivalent to a NAPA ST85 or GP Sorensen SF74.  You need a continuous-duty rated relay, with a capacity of at least 60A and referably closer to 80A for reliability.  You also need the relay to have an isolated ground to work with these schematics.  You can do this with a BWD SS664, which is easier to find, but the diagrams would need to be modified to suit the different relay design.
  • FS8 is a temperature switch.  Very important, you need a switch that is normally open, not a temperature sender.  Here is where you’ll need to do some hunting, because you need to find something with the right thread for you to mount somewhere you can use, and with the temperature range you want.  FS8 used to be an easy pick for Fords with an adjustable temperature, but I haven’t been able to find it lately.
  • Other relays shown here can all be a standard Bosch style auto relay.  I’ve been getting mine from All Electronics for years.  No financial interest in them, I just find them to be a good supplier, and they seem to have the best price on these.

Scheme 1

As basic as it gets, here.  This one will run any time the coolant is over the set temperature, including with the car turned off.

Scheme 1
Electric Fan Control – Scheme 1

Scheme 2

This adds an AC Demand input to Scheme 1.  This wire is usually easiest to find at the system pressure switch in your underhood A/C system.  This wire will be powered all the time when your A/C is turned on from inside.  For most cars, there are two wires here – make sure you tap into the wire that heads for the interior, not the one that runs from the pressure switch to the A/C compressor clutch.  The compressor clutch wire will cycle on and off with A/C system pressure, the wire to the interior will not.

Scheme 2
Electric Fan Control – Scheme 2

 Scheme 3

This is the most versatile setup.  Here, we add a switch (run to the interior) which will allow you to turn the fan on manually, off completely, or allow the same automatic operation as the first two schemes.

Scheme 3
Electric Fan Control – Scheme 3

You can easily build off these schemes for more complex setups.  A relay added off the I terminal of the SS74 will provide the ability to turn off the fan automatically when the ignition is off, for instance.  One more relay, another sender, and a second SS74 will use both available speeds of the fan, though I’ve never personally seen much use for the low fan speed.

Please feel free to disseminate, modify, and enjoy!